RSA (Agent) Dashboard
Location
File > Dashboard - RSA
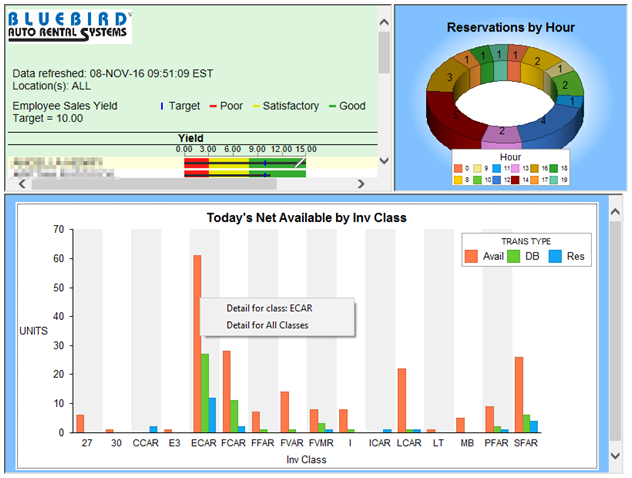
Top Left: Agent Yield bullet chart. Indicates how close agents are to the target and thresholds chosen in the parameters screen.
Top Right: Indicates the number of reservations for the selected RSA location(s) by the hour. Chart is interactive and can be moved using <Ctrl> mouse movements. Clinking on any hour will select only that hour. Clicking on blank space on chart will select the entire chart.
Bottom: Availability Chart will show Available, Due-backs, and Reservations for the selected RSA location(s). Clicking any data in the chart will allow you to see the actual data that makes up the chart. (i.e. Clinking on Avail column for ECAR will display the above menu. Clicking on the Detail line will show a list of the Available units.) This will work the same for DB and Res. Clicking on the [Previous] button at the top of the page will return you to the chart.
Pressing [Refresh] at the top of either Dashboard will update all the data and refresh the screen.
