MGR (Manager) Dashboard
Location
File > Dashboard - MGR
Top Left: This is the MTD metrics that come from the location(s) selected in the parameter screen for the MGR dashboard. The Spark Graph to the left of the numbers is a trending graph for the month to date.
Top Right:This chart indicates the top 10 MTD yields for your rental agents, based on the yield calculation parameters set in the parameter screen. Note that contracts closed through midnight the day before are included. If you back-date a contract, be sure to click on the DBR icon to back-date all Miscellaneous Charge records as well.
Bottom Right:Source of Business chart. This chart is interactive in a similar way to the Reservation by Hour chart above. Note that contracts closed through midnight the day before are included.
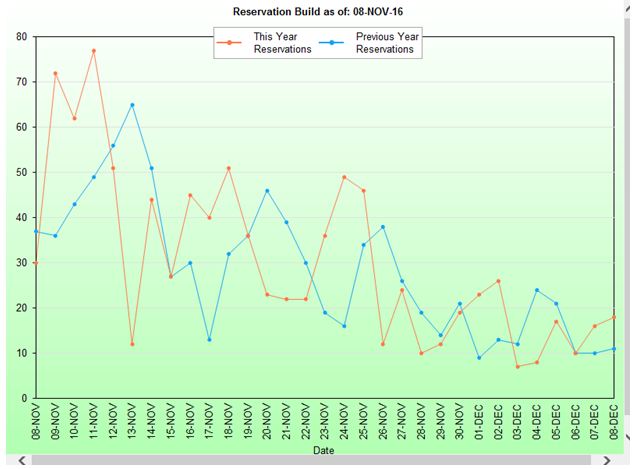
Bottom Left: This is a menu for Reservation Build Charts. Clicking on any link will open a new window with a full size chart of Reservation Build data. You can return to the MGR Dashboard screen by clicking the [Previous] button at the top. The charts show an actual count as of today for the next 30 days compared to last year at the same time.
The four charts are
- Actual number of reservations
- Actual number of days booked
- Average T&M rate of reservations booked

